Inputless DB
Graph database. Documents in, subgraph out. An answer you can walk.
What you get
- •Load documents without ETL. Ingest content directly - no manual pipelines or transformation steps. Inputless DB accepts documents as-is and builds the graph from them.
- •Graph is automatically constructed and reported. The system builds and maintains the graph from your data and surfaces it in the Graph Explorer - no hand-built schemas or manual mapping.
- •Graph correlation report automatically connects data. Connections between entities, topics, events, and documents are discovered and reported automatically, so relationships and explanations are always up to date.
- •Scales to petaflow. Built to handle petabyte-scale data flow and throughput. Inputless DB is designed for enterprise and intelligence workloads where volume and velocity demand petaflow-grade capacity.
- •Built for airgapped environments. Isolated, offline, or high-security networks. No public cloud. No external APIs. The model runs where connectivity is restricted or banned.
How we designed it
Five rules that make Inputless DB a graph store for RAG and the Cognitive Substrate, not a generic property graph.
Anticipation over reaction
Features that predict or precompute what will be needed, not just answer when asked.
Cognitive as first-class
Intent, patterns, and mental state are primary dimensions of the graph and of retrieval - not secondary filters.
Graph-native explanation
Every answer and decision can be traced to a subgraph; explanation is a query, not a log.
Unified behavioral + semantic
Same graph and same APIs for "what was said" and "what was done"; similarity over both.
Bounded and transparent
Contracts (time, node budget, confidence) are explicit and first-class.
Graph Explorer in action
Inputless DB's Graph Explorer: trace answers to subgraphs, explore node types and relationships, and see cognitive and behavioral data in one unified view.
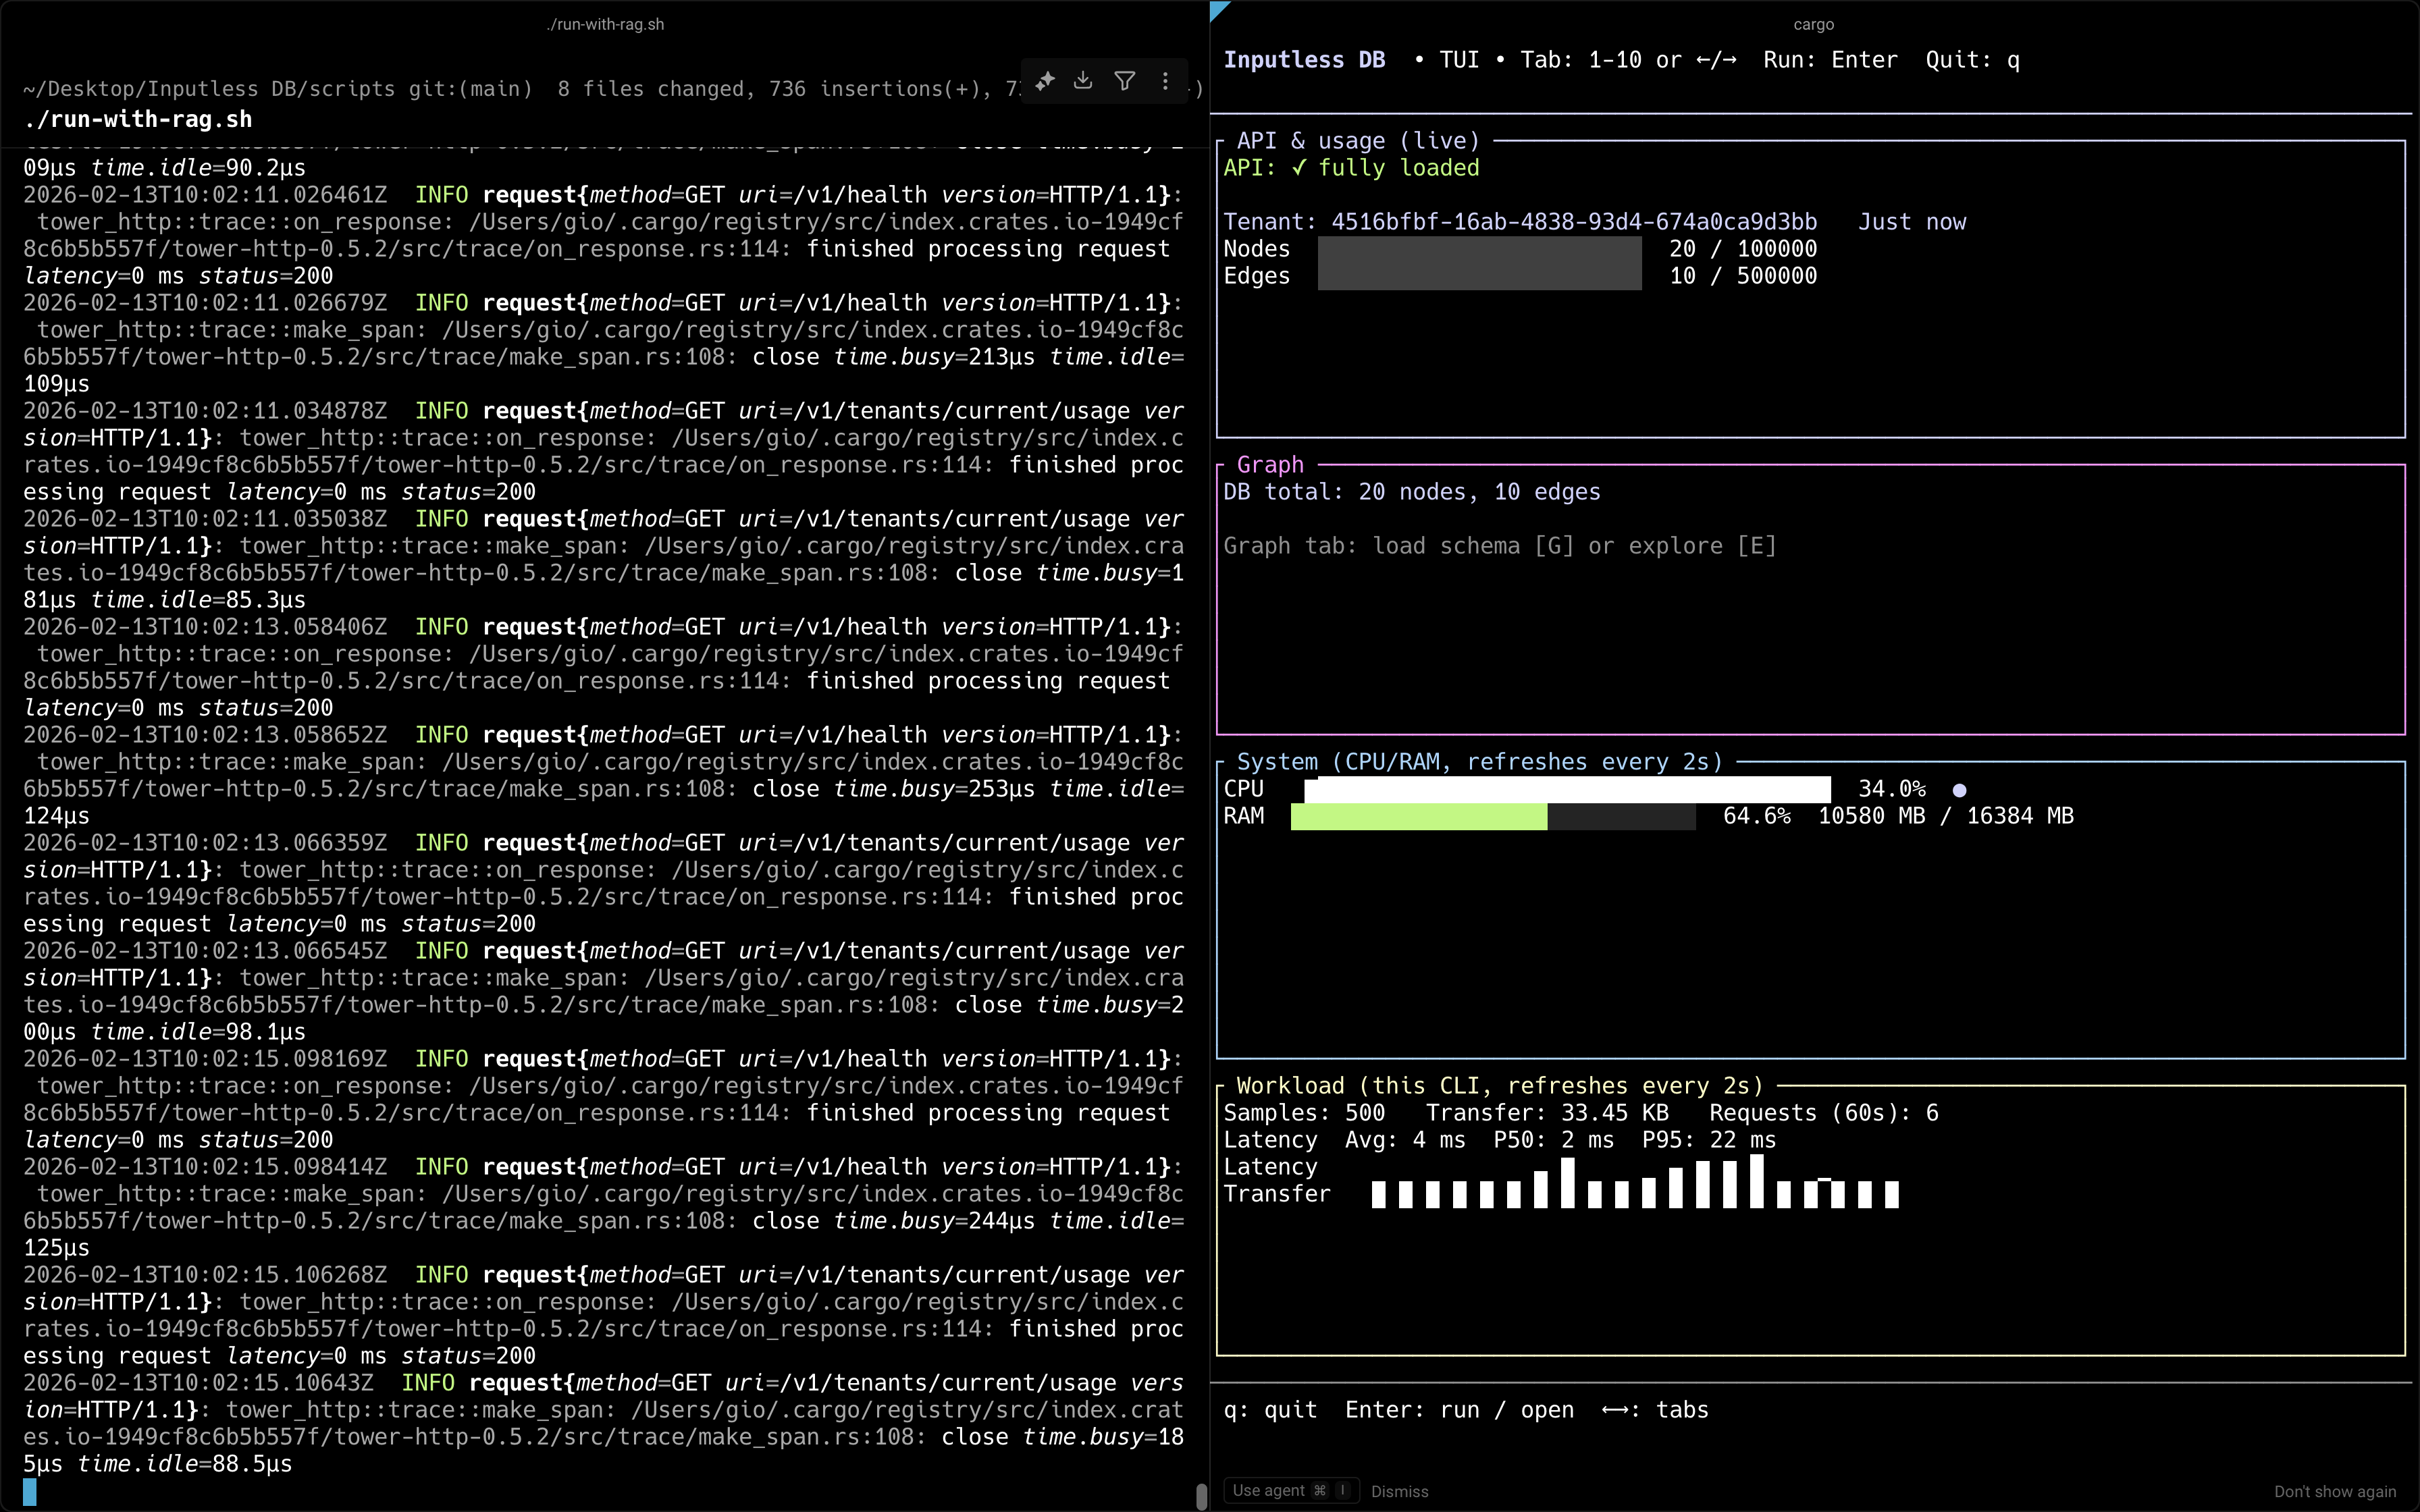
Inputless DB CLI: terminal UI for monitoring API health, tenant usage (nodes/edges), graph totals, system resources (CPU/RAM), and CLI workload with latency and transfer metrics.
.png)
Graph Explorer: query result with Document, Entity, Topic nodes and CONTAINS_ENTITY, HAS_TOPIC relationships. Click a node to view details and trace explanations to the subgraph.
.png)
Node types (Document, Entity, Event, Topic) and relationship types (CONTAINS_ENTITY, HAS_TOPIC, INVOLVES, LOCATED_IN, MEMBER_OF, etc.) in one unified graph - behavioral and semantic in the same APIs.
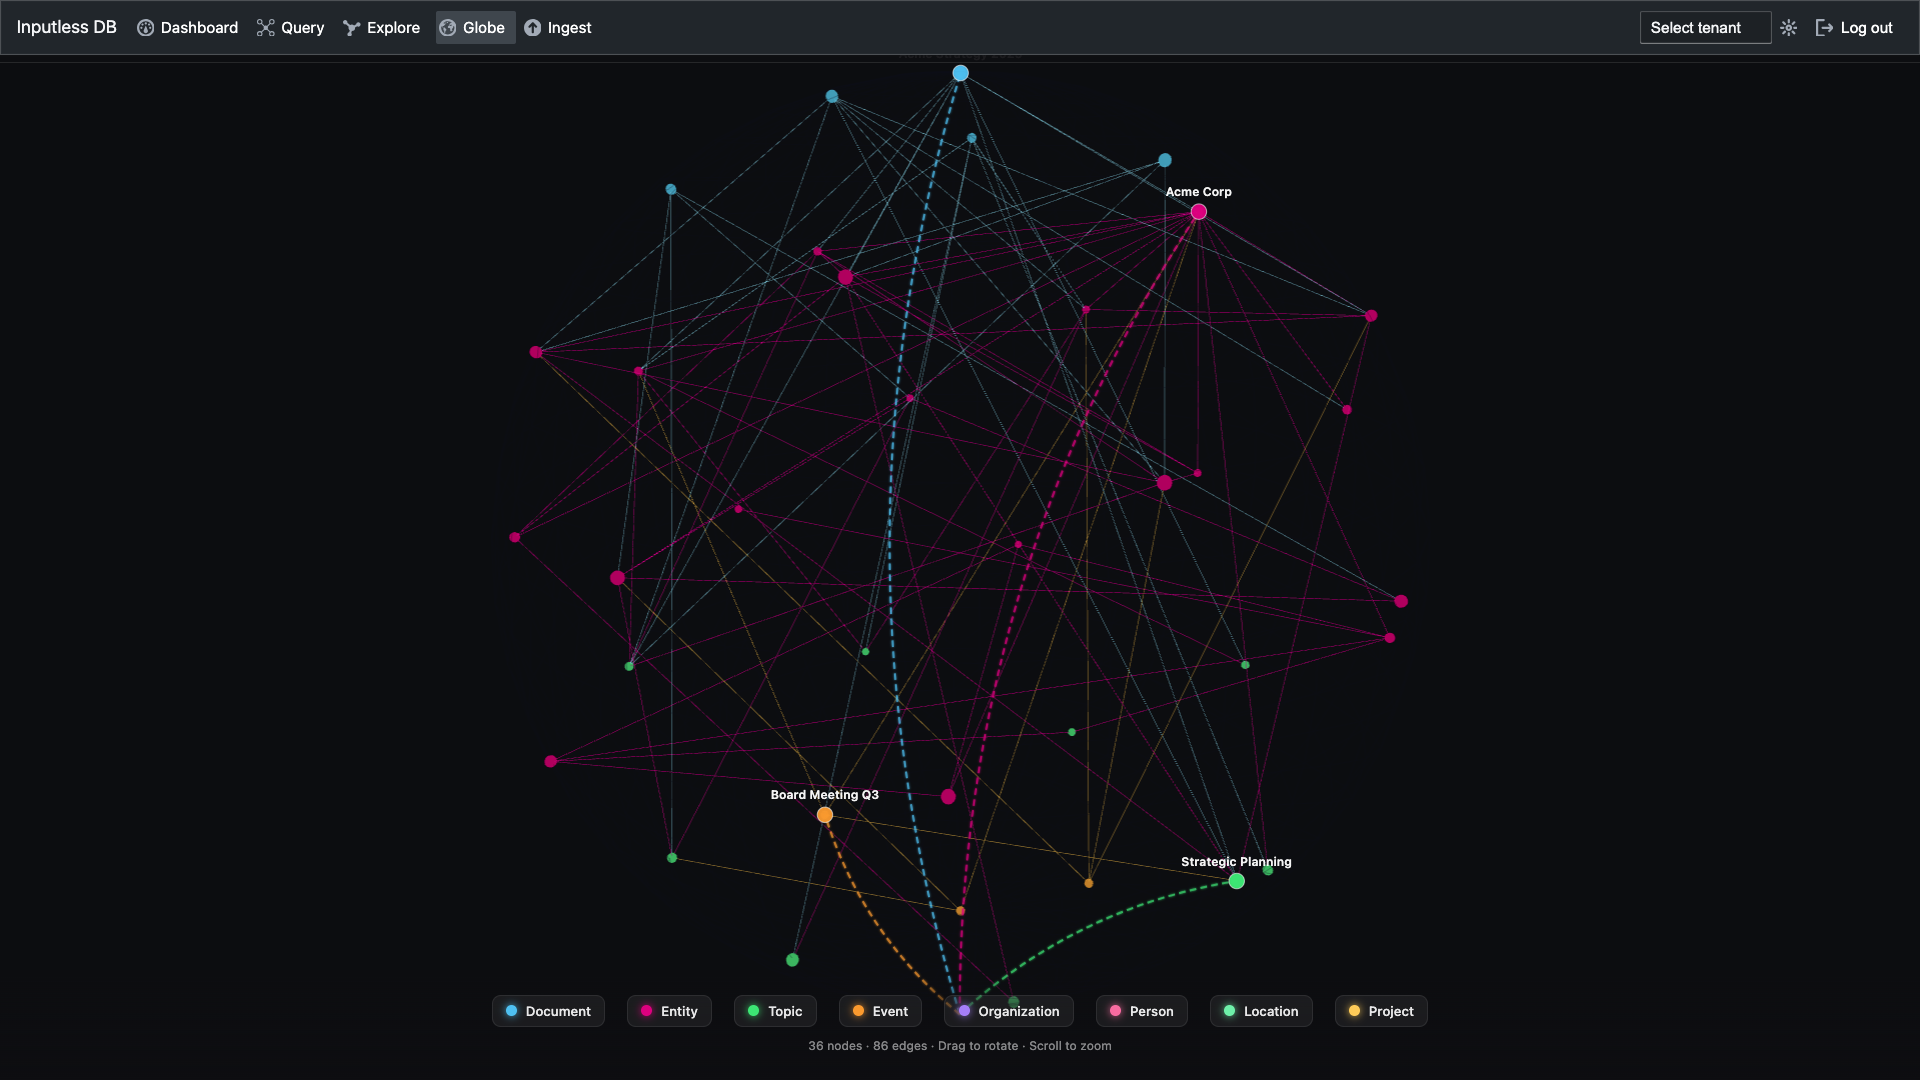
Full graph view: organizations, events, topics, and entities (e.g. Acme Corp, Board Meeting Q3, Strategic Planning). Transparent scope (node/edge counts) and cognitive-first dimensions.
Explanation is a query, not a log
With Inputless DB, every answer and decision can be traced to a subgraph. Explore the graph, filter by label and relationship, and inspect node properties - all with the same APIs and the same graph for what was said and what was done.
Deploy Inputless DB